Barcelona’s Bicing on a map that says what it knows and what it doesn’t
Barcelona Pulse puts the public data of Bicing, Barcelona’s bike-share system, on a map: how each station stood, how the city changes over a day and which areas would be close to a station if another one were added. I built it in October 2026 with an AI coding assistant; the decisions and the review of every part are mine. The app is in Spanish.
 Jaume Pérez SentísWeb developer in Barcelona
 Enlarge the screenshot
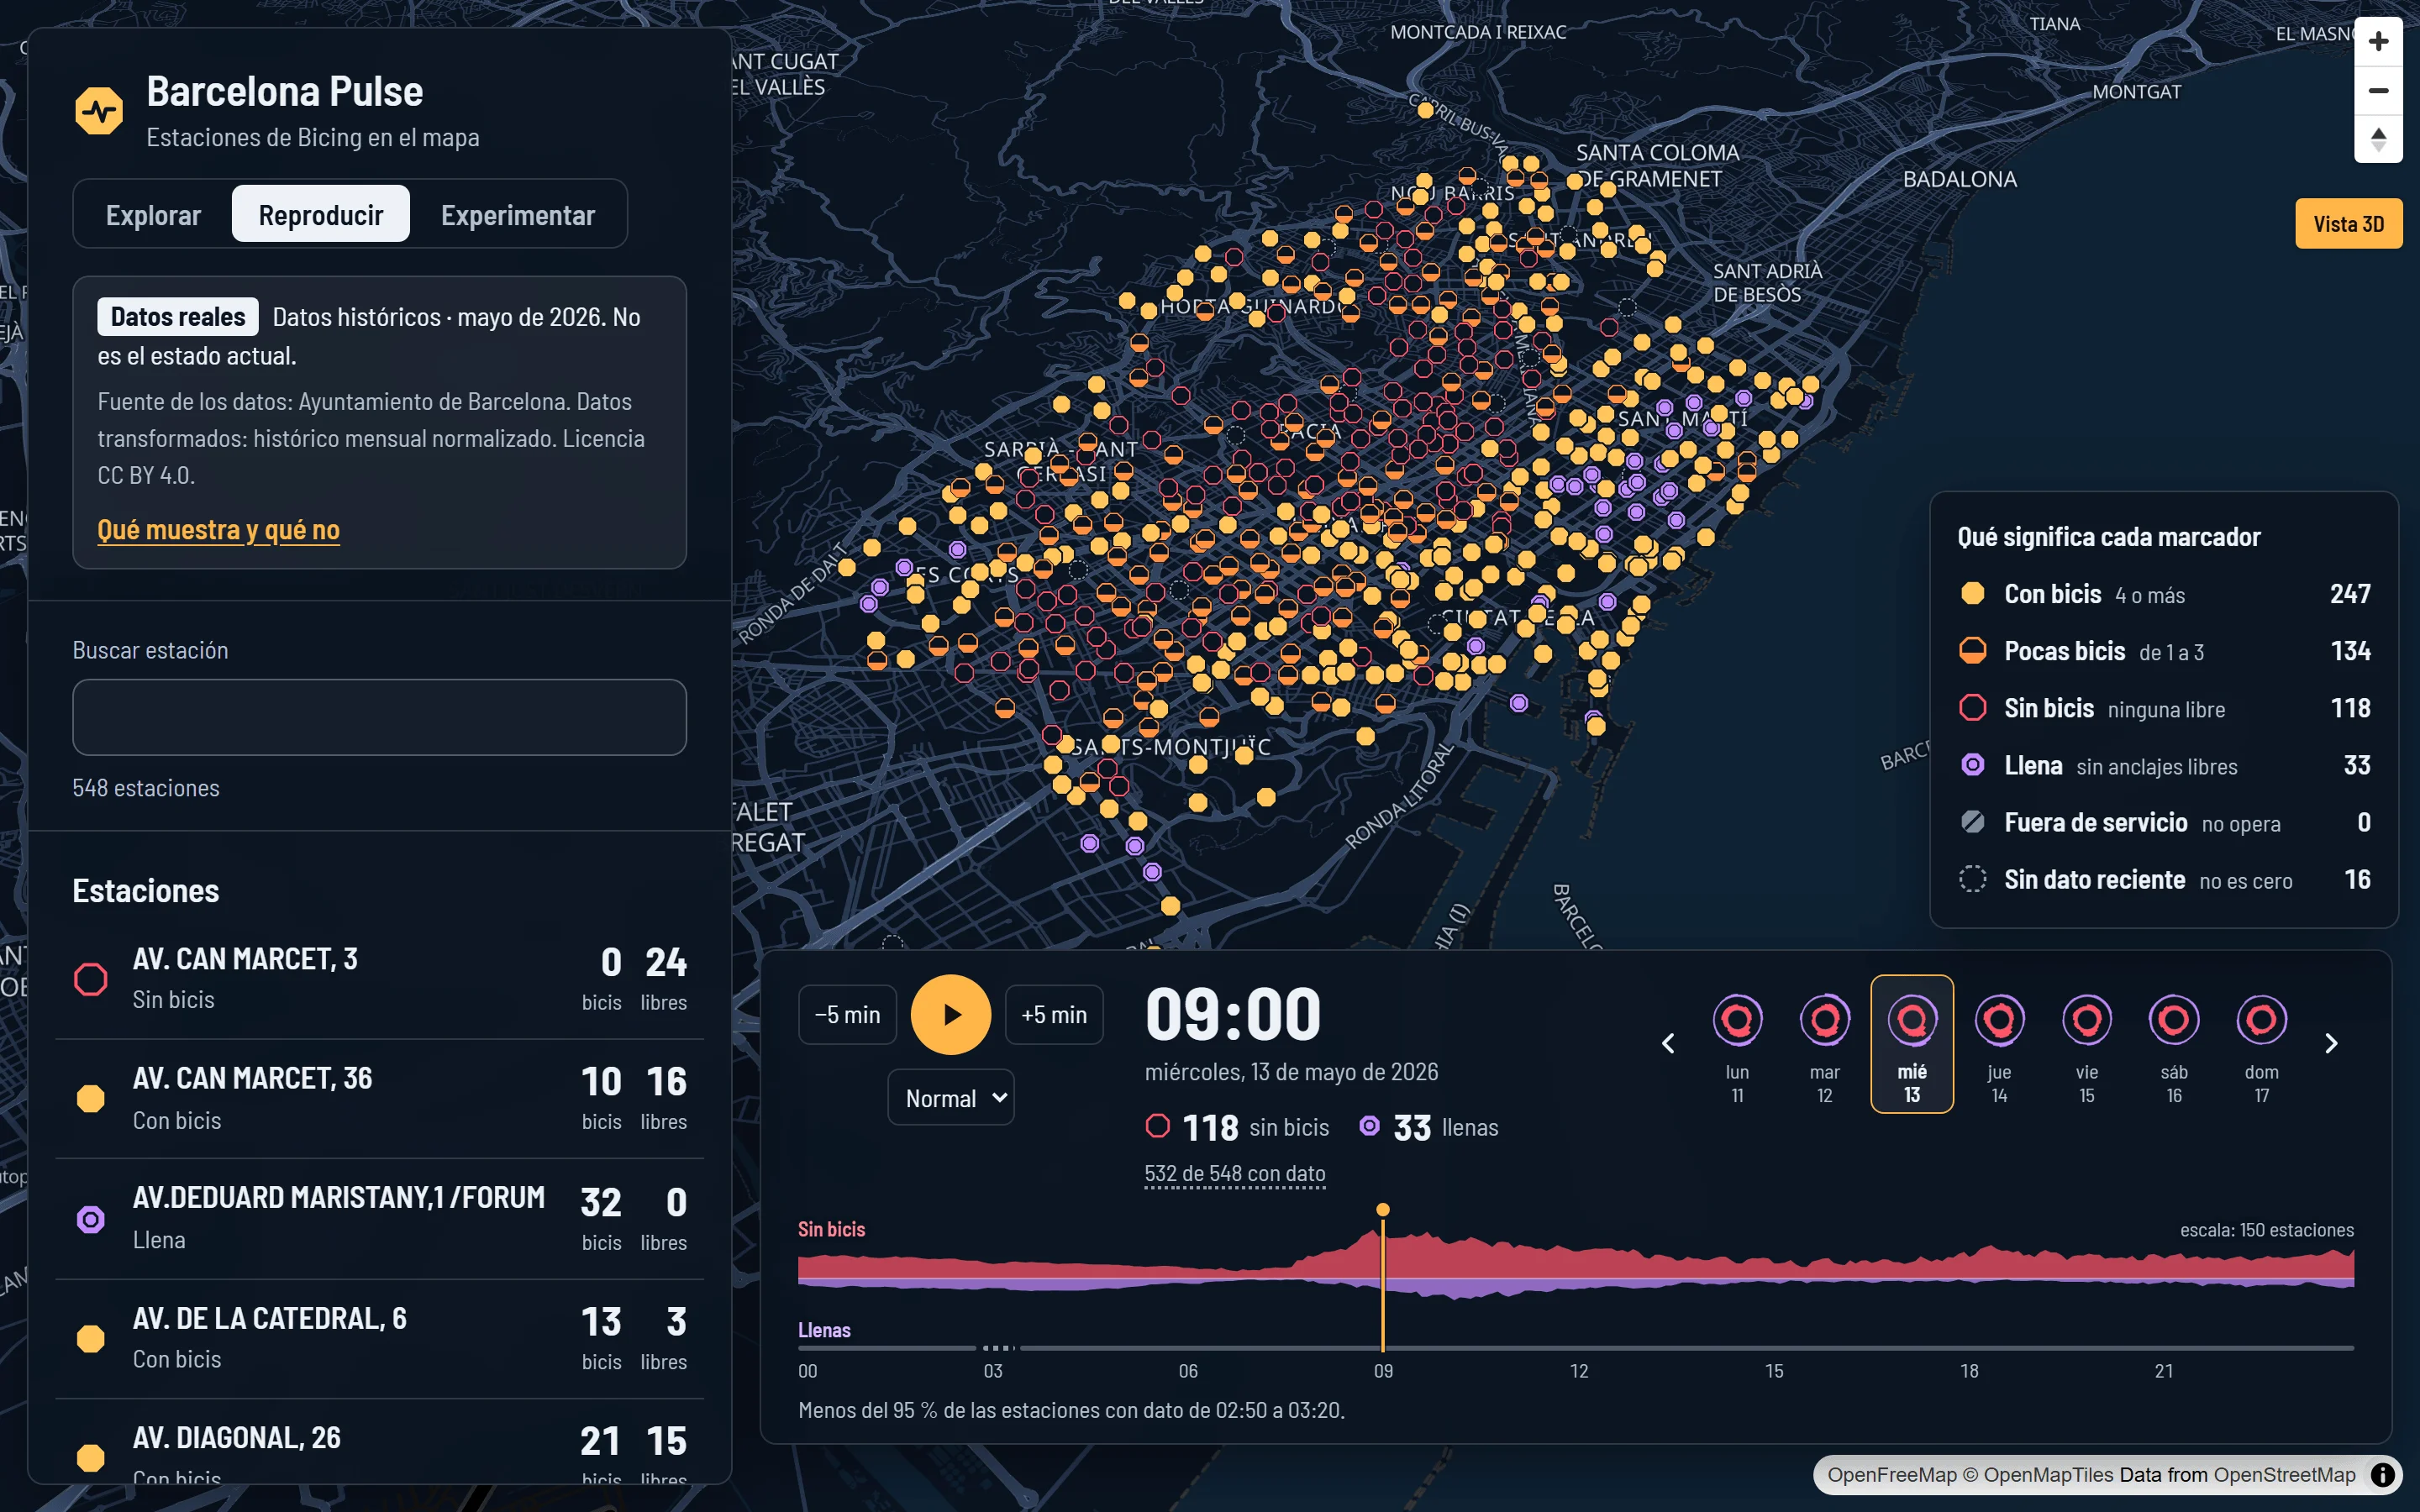
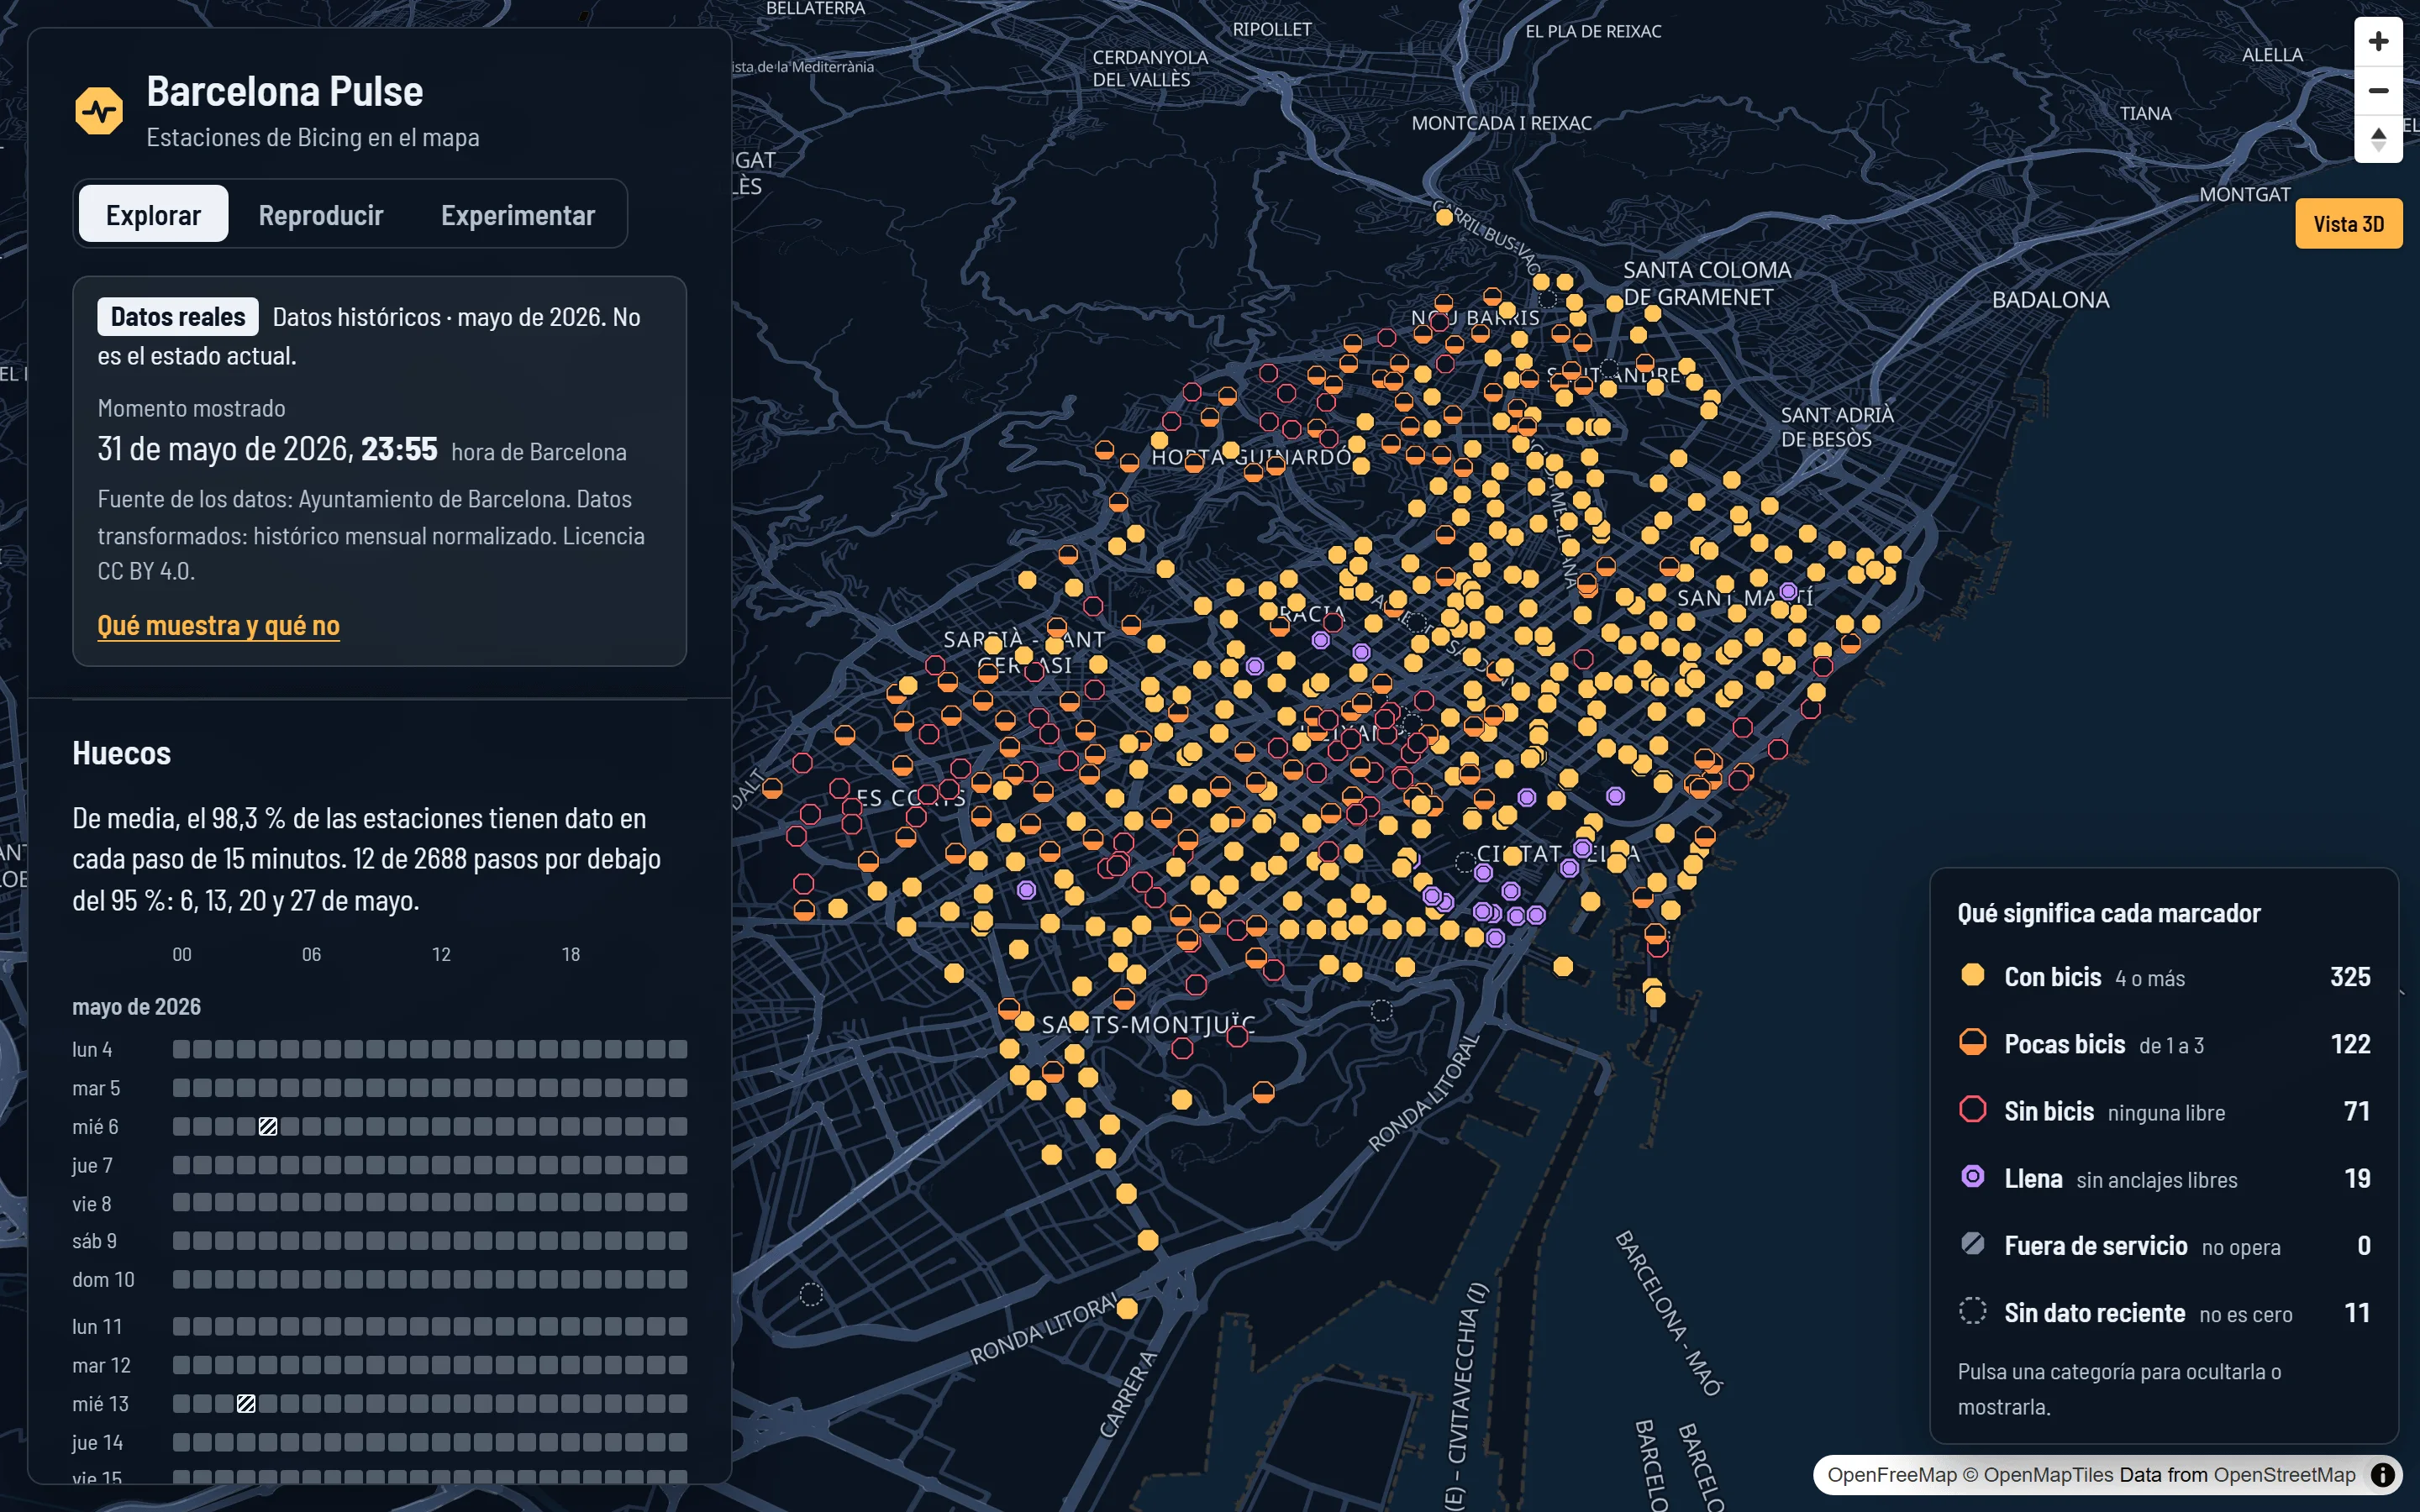
Every station, with its state
With bikes, few, none, full, out of service or no recent data, and how many of each at that moment.
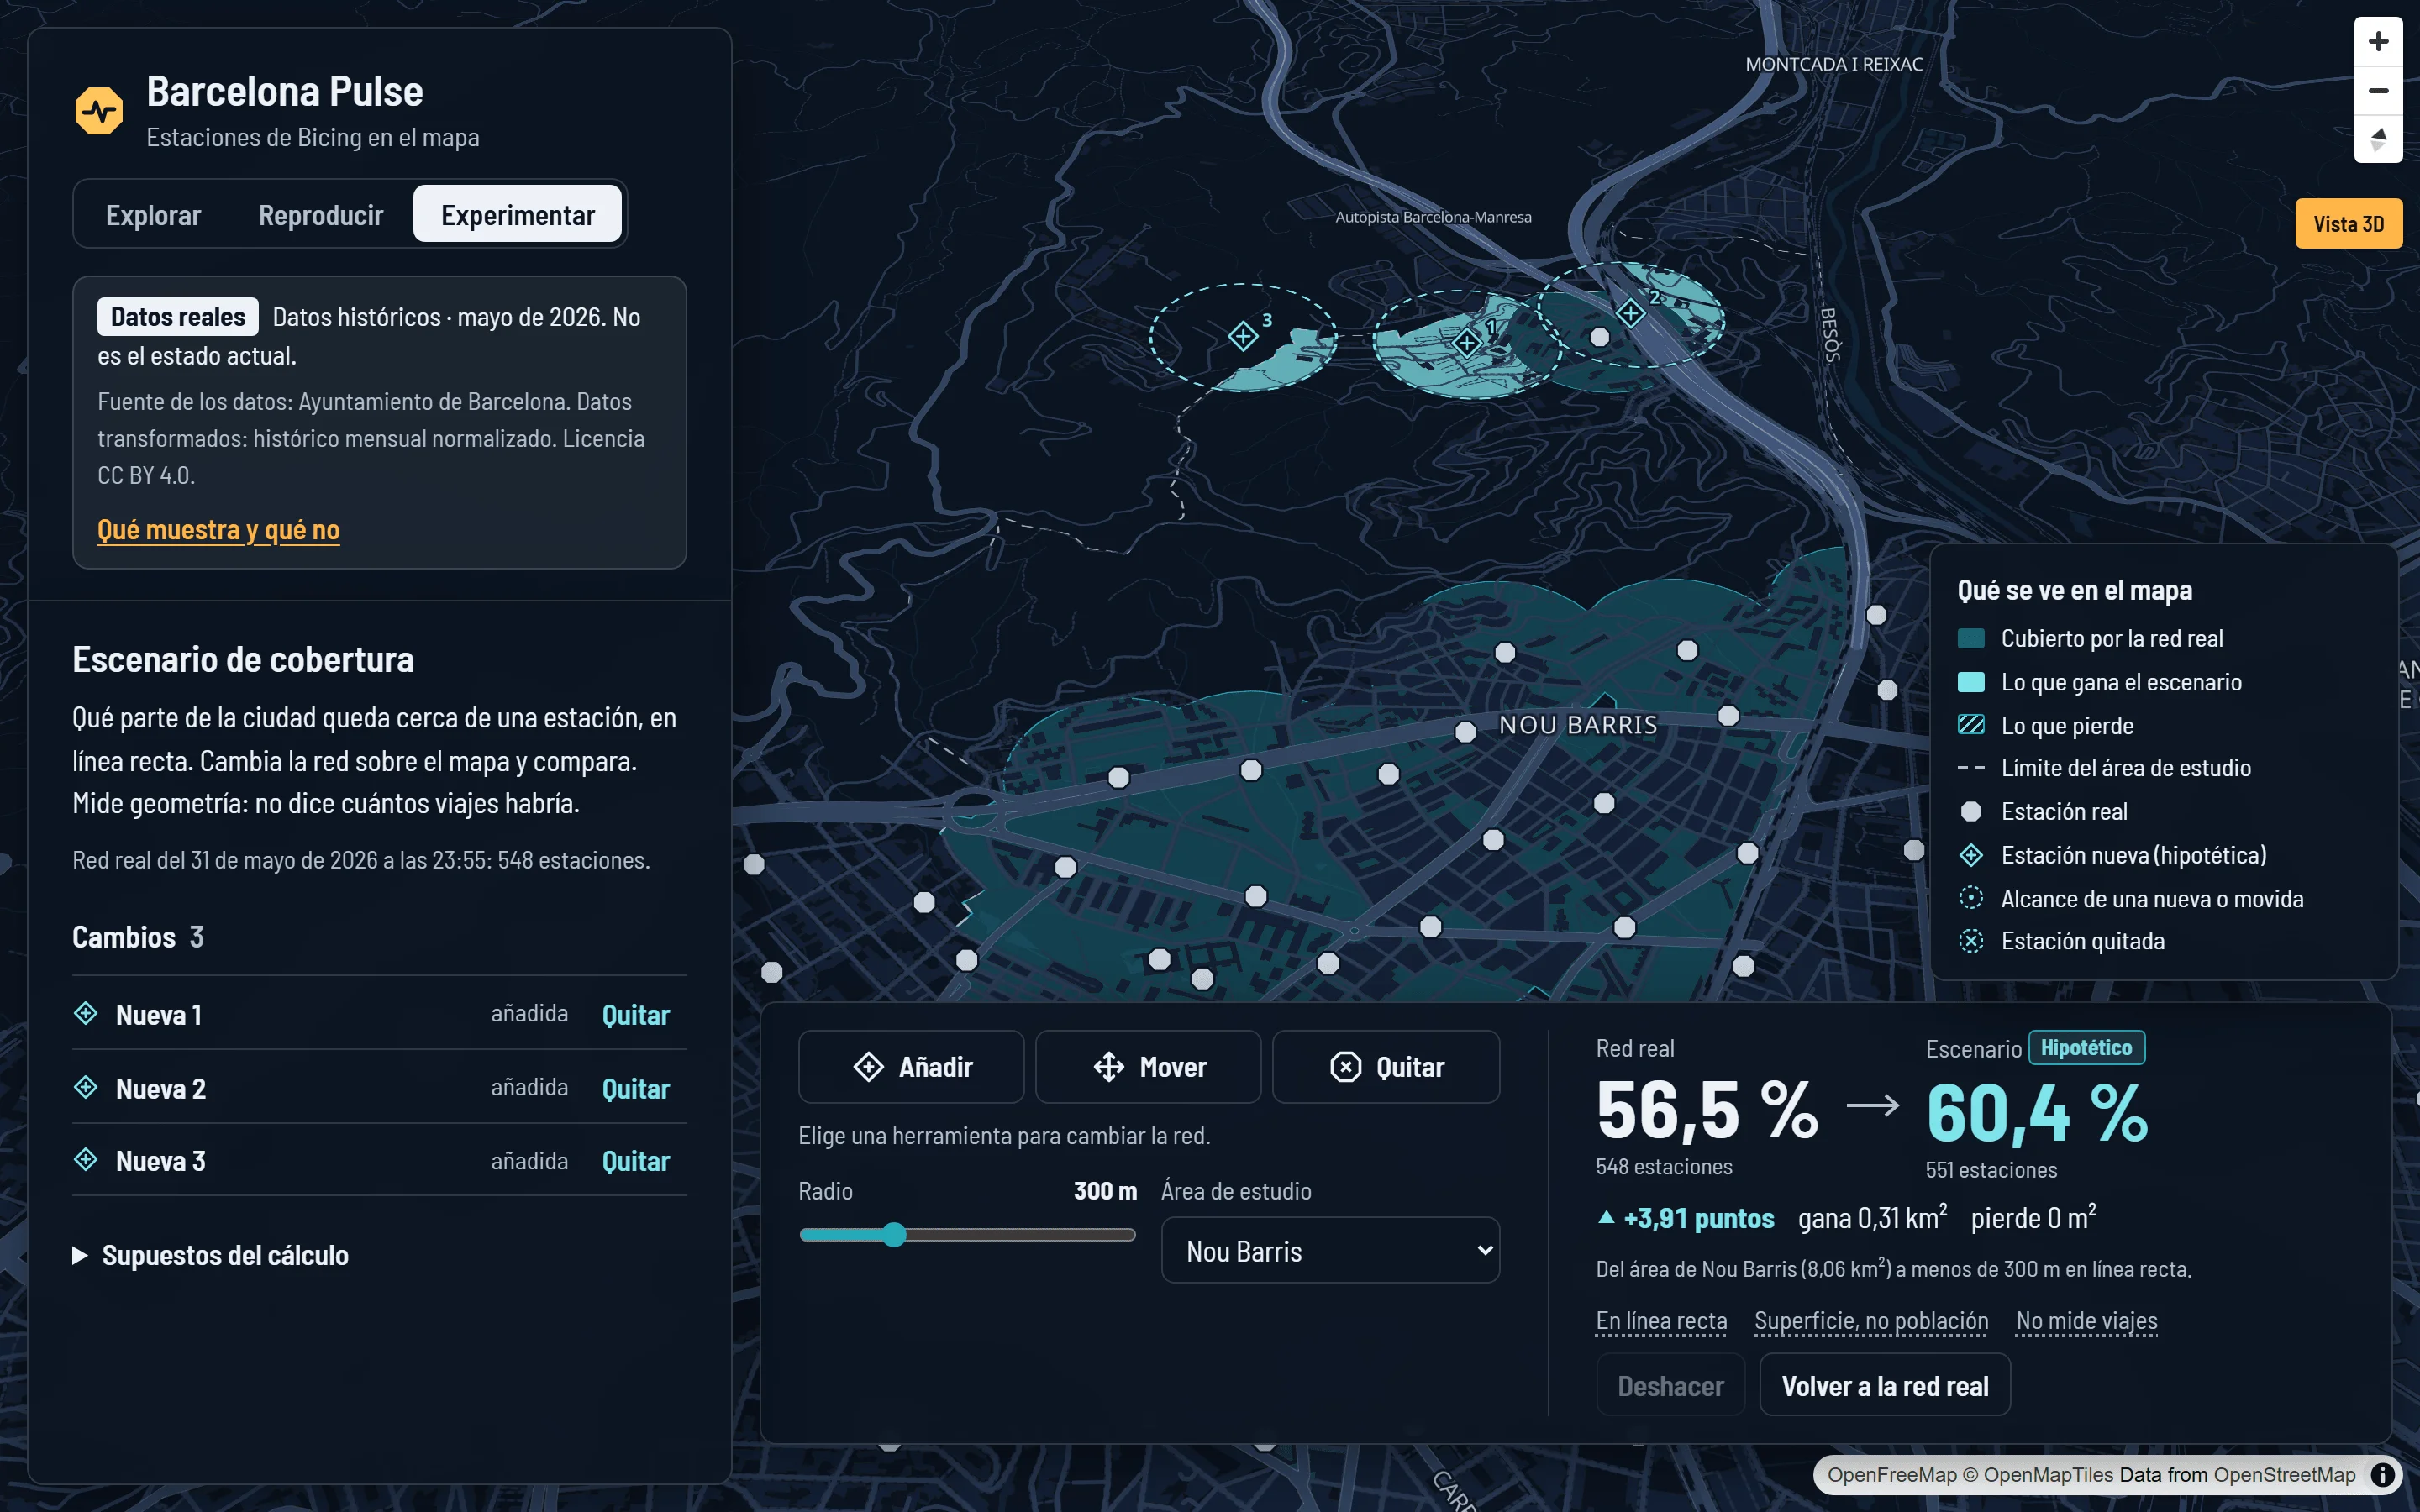
A day in May, step by step
A whole day in five-minute steps, like a video, with the day and time in view.
The shape of the day
When stations empty and fill up, and at which hours part of the data is missing.
What it knows and what it doesn’t
Real data from May 2026, not the current state: where it comes from, under which licence and what’s missing.
Open data that needs careful reading
Barcelona City Council publishes every five minutes how many bikes and free docks each Bicing station has. What anyone can download without signing up are monthly files: about four million rows a month, with blank hours, stations that haven’t reported for months and rows that contradict each other.
Put that on a map and it’s easy to mislead without meaning to: a station nobody knows anything about looks empty, and an hour without data looks like a drop to zero.
Barcelona Pulse shows what the data says and, next to it, what it doesn’t: when each figure is from, where it comes from and what’s missing.
Three modes and a limits sheet
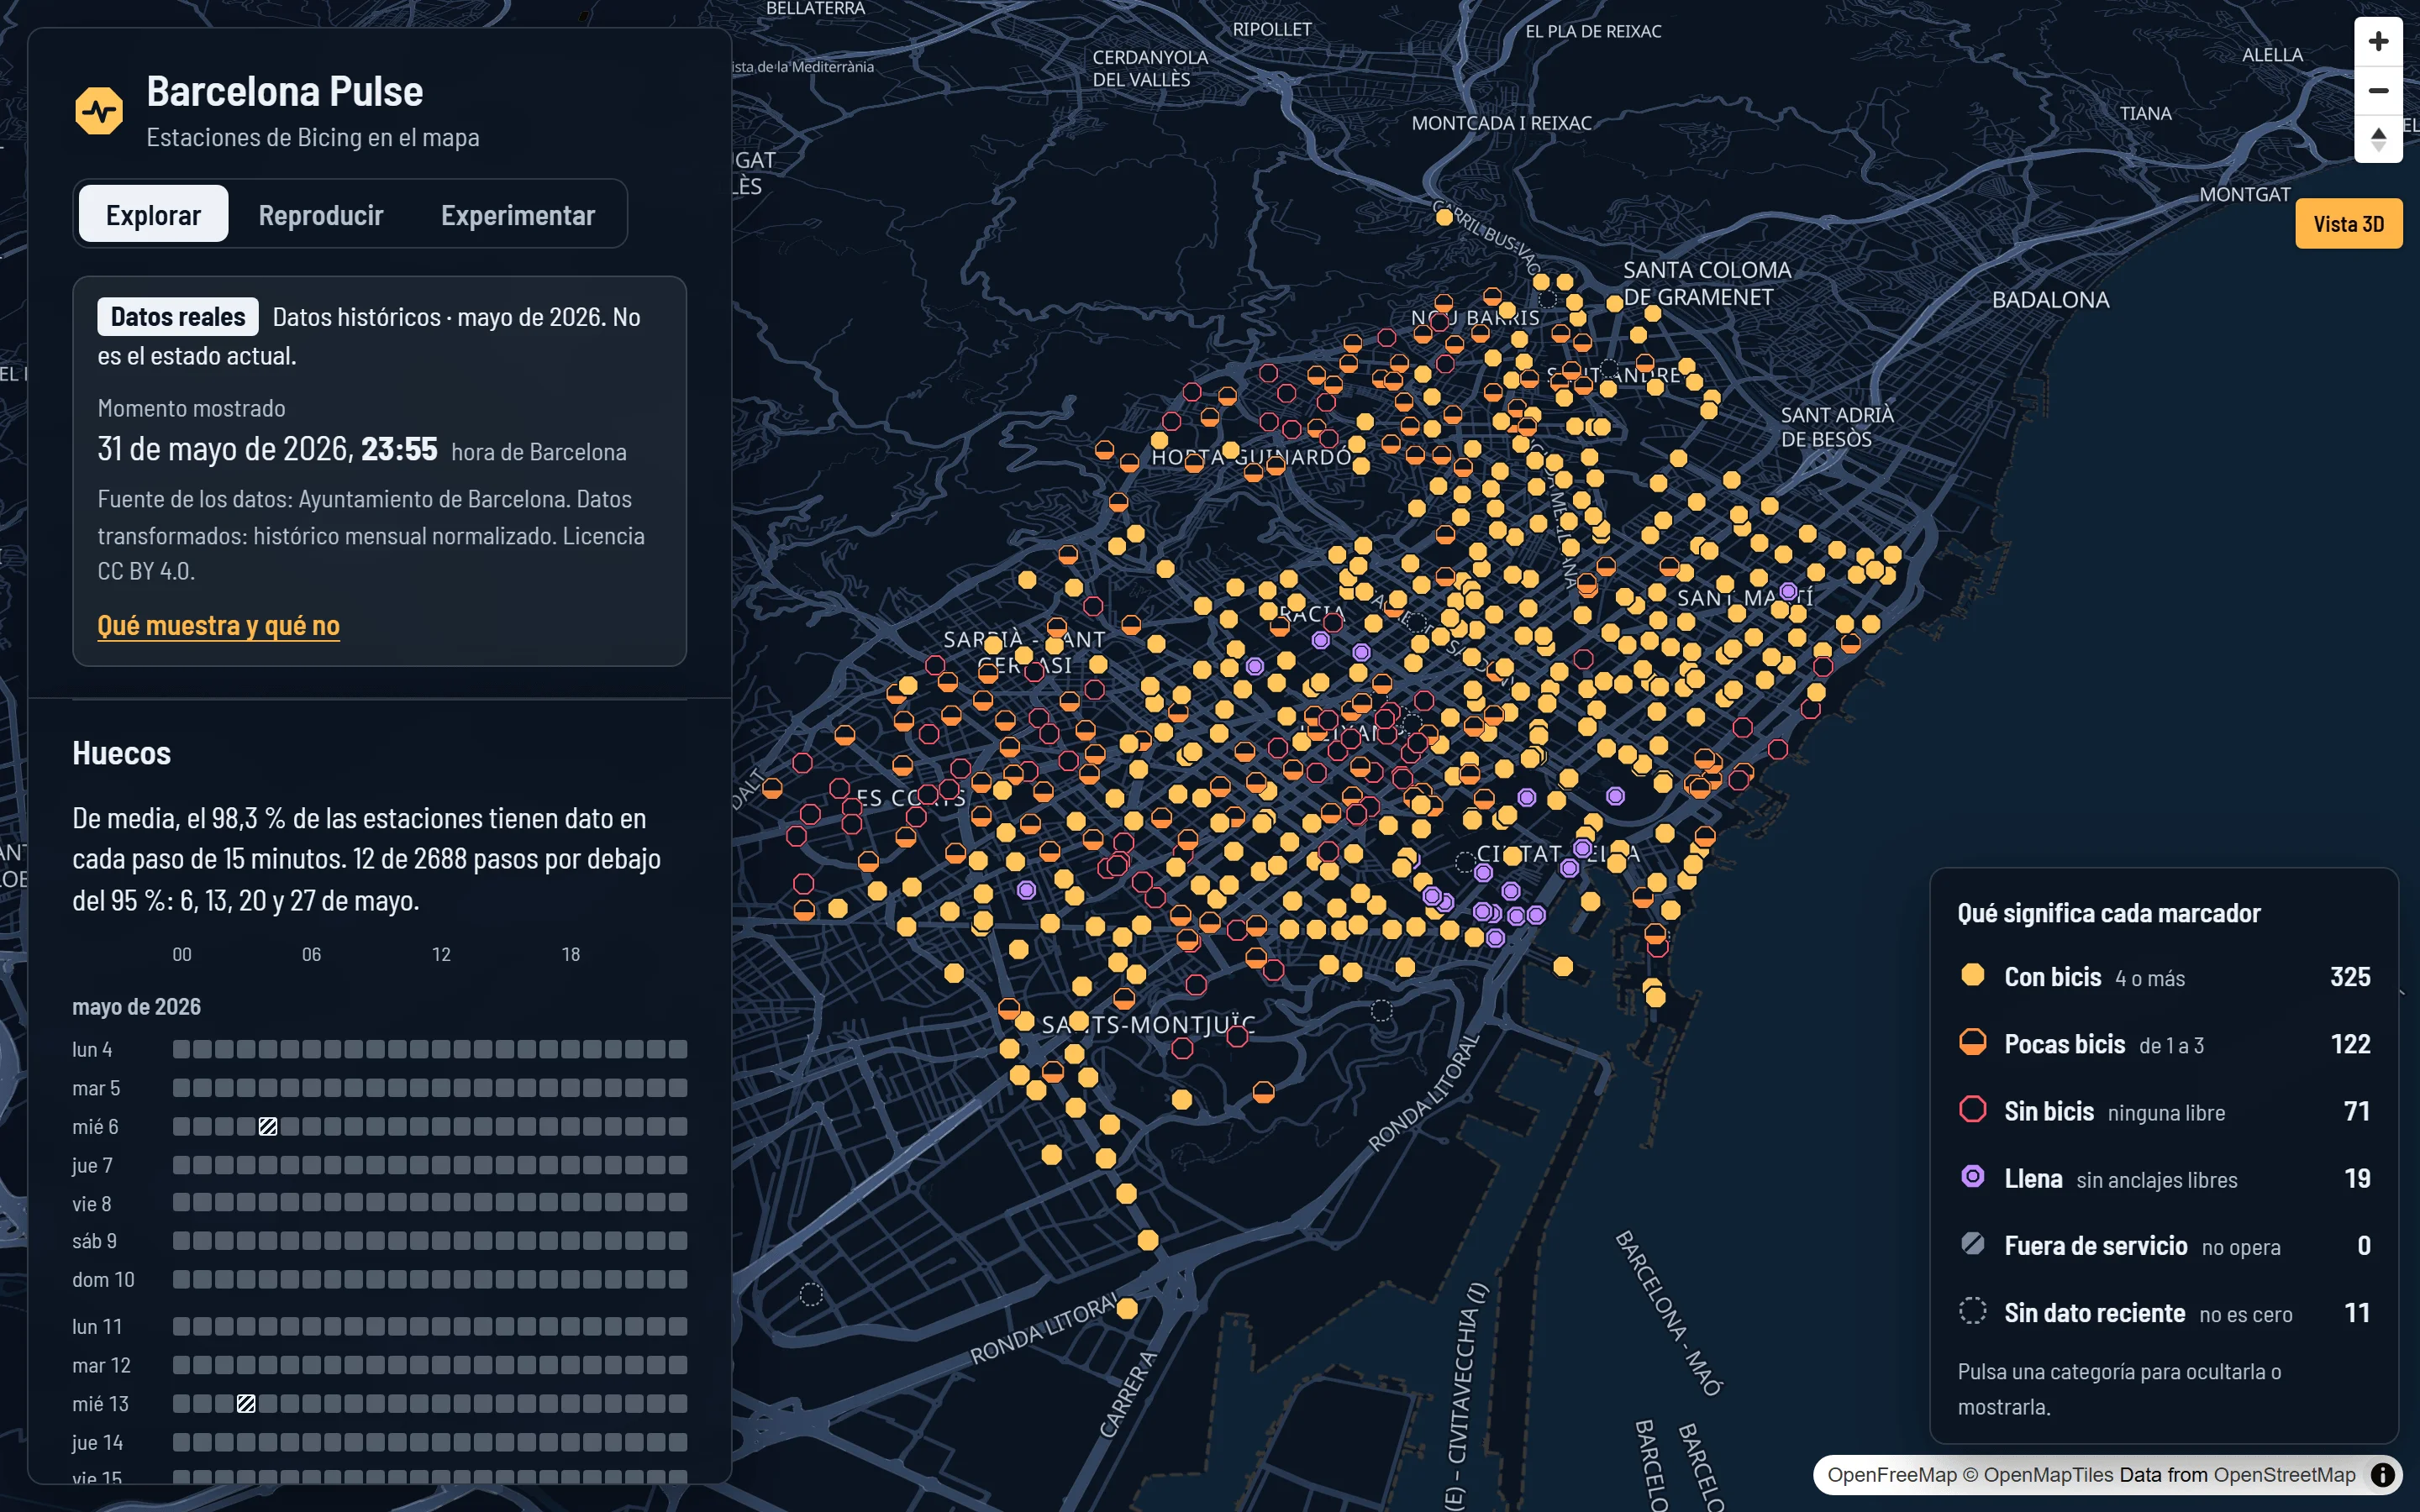
Explore
How each station stood at a given moment: bikes, free docks or whether it was closed, with the time of the data and where it comes from. If a station doesn’t report, the app says so instead of marking it empty.
Replay
A day in May 2026 in five-minute steps, like a video. Below it, the shape of the day: when stations empty and fill up, and at what times data is missing.
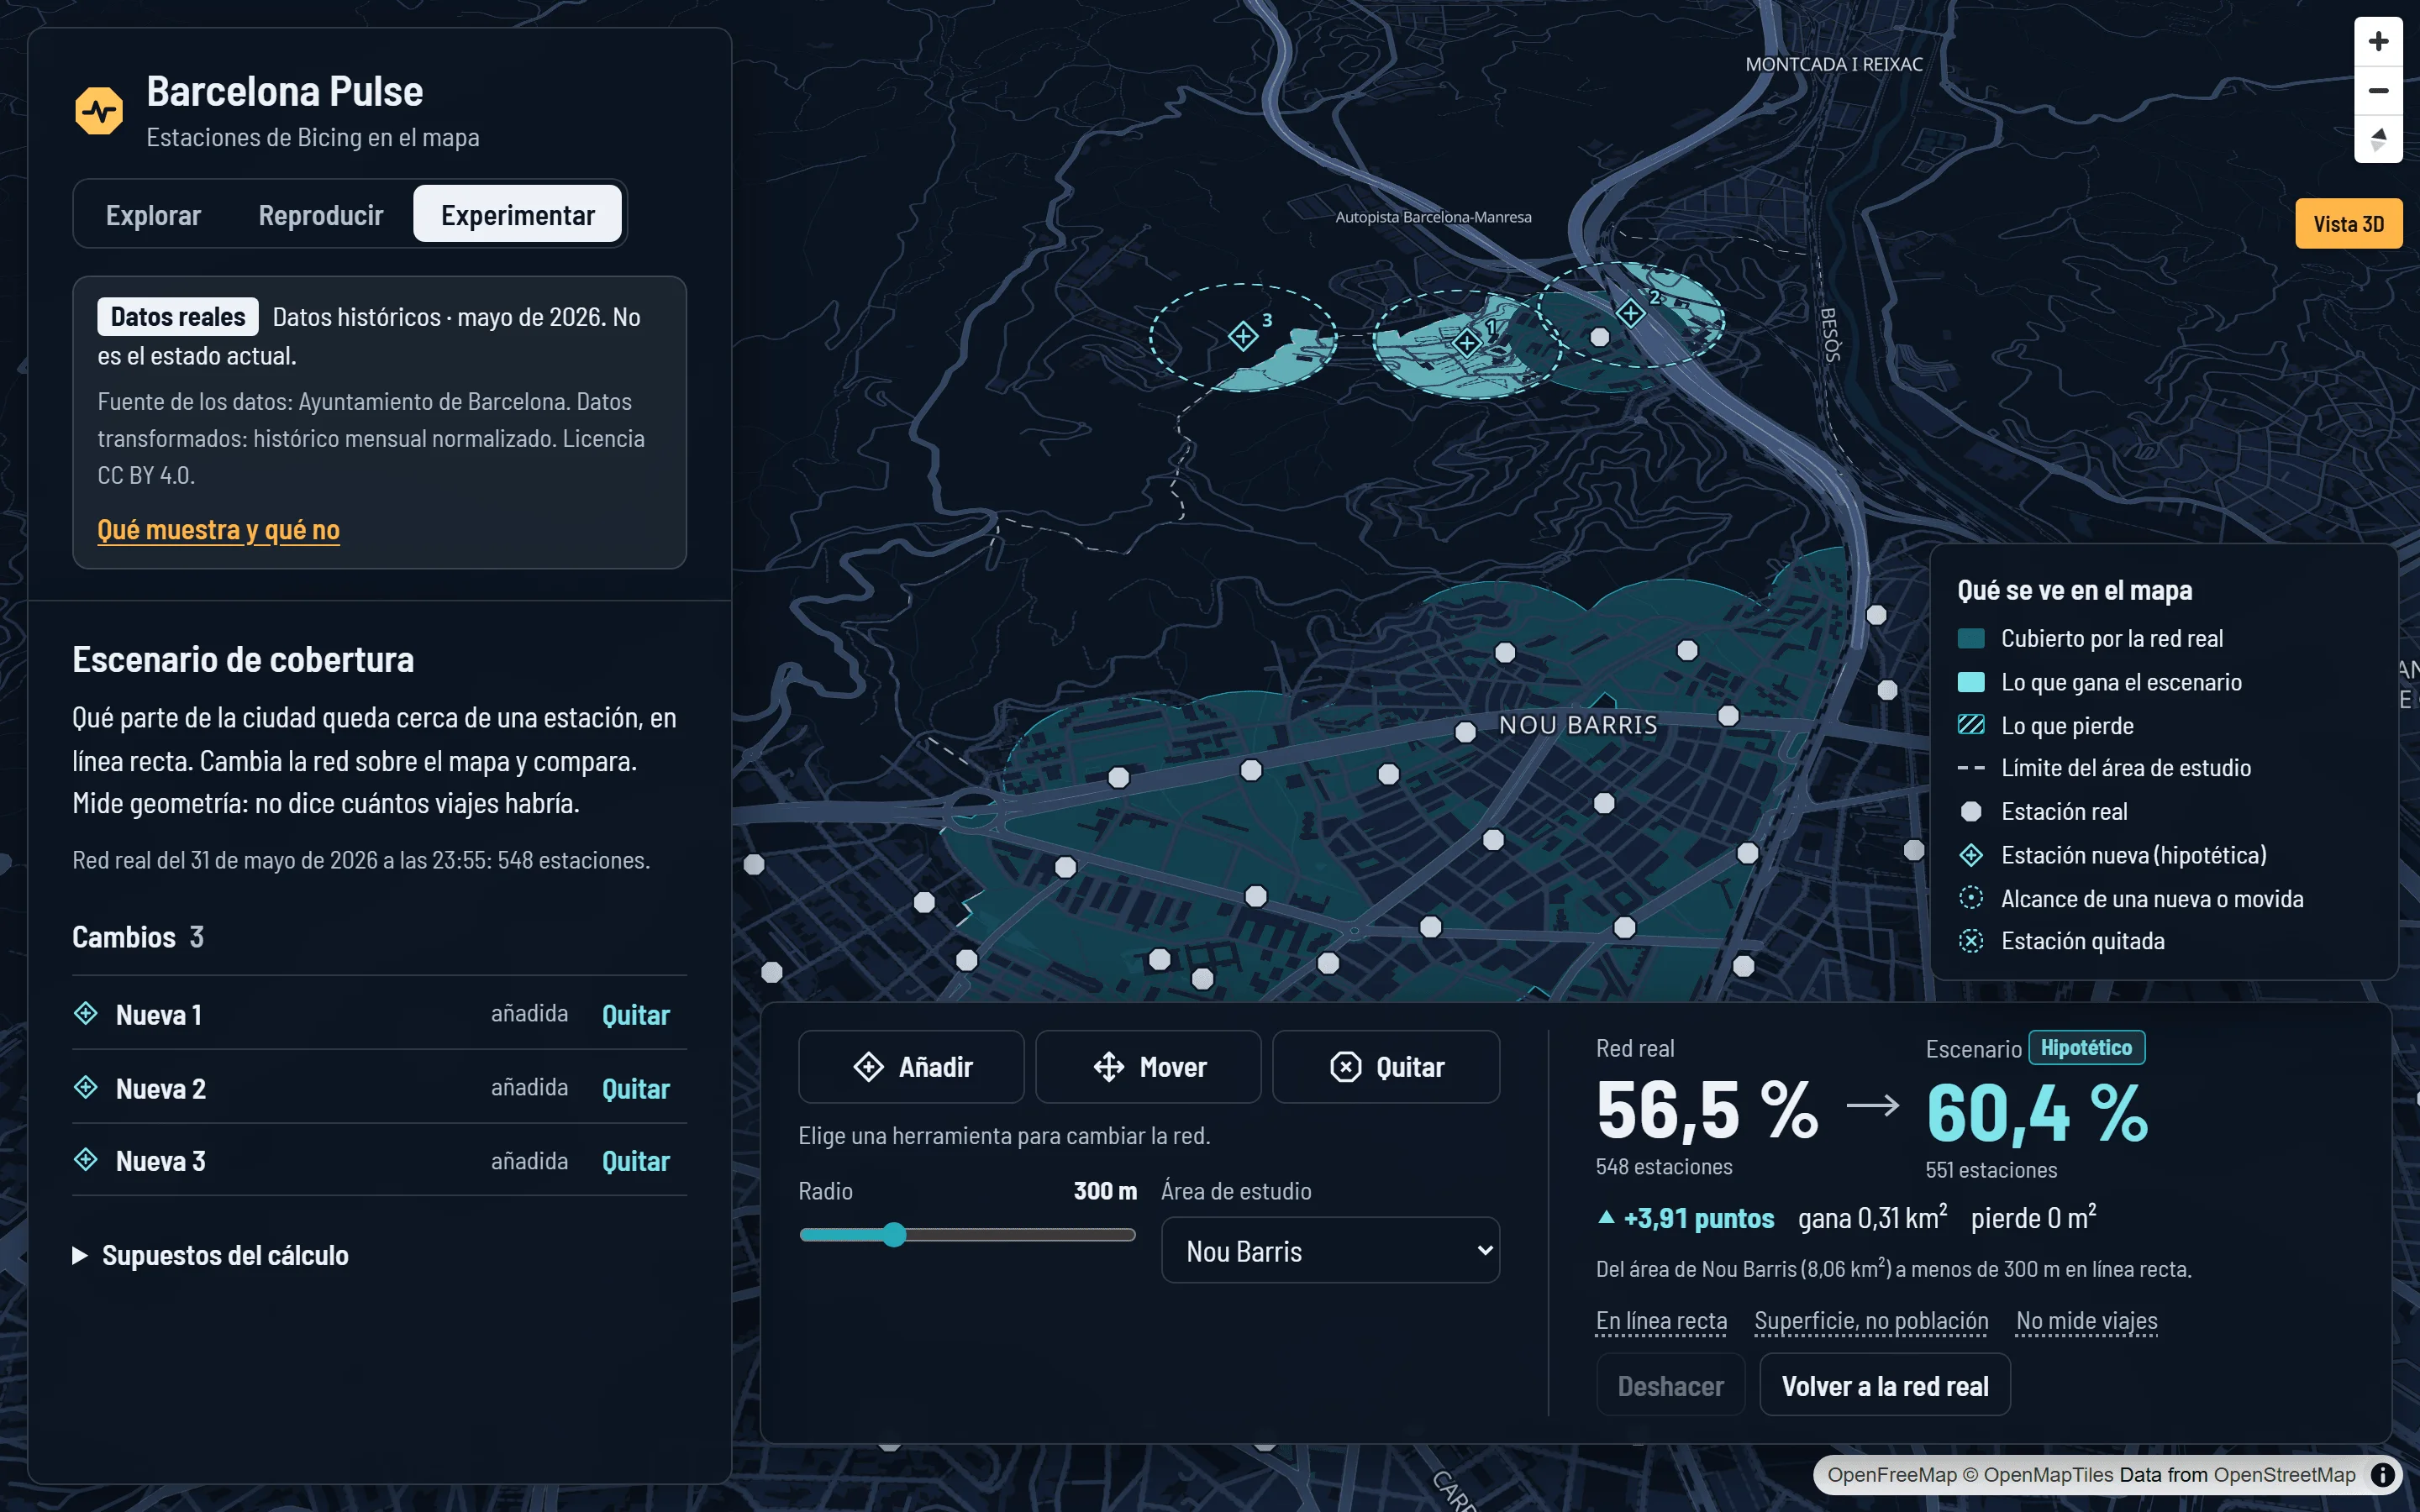
Experiment
Add, move or remove stations and see how much ground lies within a given distance of one. Across Barcelona, 56% is within 300 metres in a straight line.
What it shows and what it doesn’t
A sheet with when the data is from, the gaps for each day and hour, which stations don’t report and why, and what the app doesn’t say.
 Enlarge the screenshot
 Enlarge the screenshot
From a public file to a live application
I decided and reviewed every part: where the data comes from, how it’s stored, what each screen shows and how it’s published. Some decisions you notice when you use it:
No data isn’t zero
If a station hasn’t reported for more than 15 minutes, it shows as “no recent data”, not as empty. A closed one doesn’t count as empty either.
Real and made-up, kept apart
The real data, a demo with made-up data and the stations you add when experimenting never mix: not in the database, not on screen.
Fast with millions of rows
The state of the whole network at any moment comes back in a few hundredths of a second, and it doesn’t slow down as weeks of data are added.
Real metres
Distances and areas are calculated in metres, in the coordinate system the City Council uses. An ordinary web map stretches them by 33% in Barcelona.
Importing twice doesn’t duplicate
Every import is recorded with its file. Repeating it duplicates nothing, and where the file contradicts itself the rows are counted instead of one being picked silently.
Tested before publishing
Over 200 automated tests, including against the real database, and every screen used on mobile and desktop before calling it done.
What you can expect from me
- Working with real, messy data without hiding what’s missing.
- Measuring before optimising, and reporting the limits next to the results.
- Taking a project from the idea to a server: data, screens, tests and publishing.
Status and limits
- It isn’t real time: it covers four weeks of May 2026.
- Coverage is straight-line distance: it doesn’t measure population, trips or demand.
- It doesn’t predict or recommend anything.
- The app is only in Spanish.
Technical details, for developers
| Backend | .NET 10, ASP.NET Core and EF Core |
|---|---|
| Data | PostgreSQL 18 with PostGIS 3.6 |
| Interface | React 19, TypeScript and MapLibre GL JS |
| Map | OpenFreeMap, with OpenStreetMap data |
| Sources | Bicing and districts: Barcelona City Council, CC BY 4.0 |
| Tests | xUnit (including against PostGIS), Vitest and Playwright |
| Delivery | Docker, GitHub Actions and a VPS managed with Laravel Forge |
| Code | Public on GitHub under the MIT licence, with the full technical case study (in Spanish): decisions, measurements and limits |
Do you have data nobody looks at because it’s hard to read?
A history, some measurements or an export that today just gets stored. Tell me about it and I’ll say where I’d start.
Tell me about your caseor message me on WhatsApp